下载地址
文件下载地址:2016 Election Polls | Kaggle(需要谷歌账号)
1.需求描述
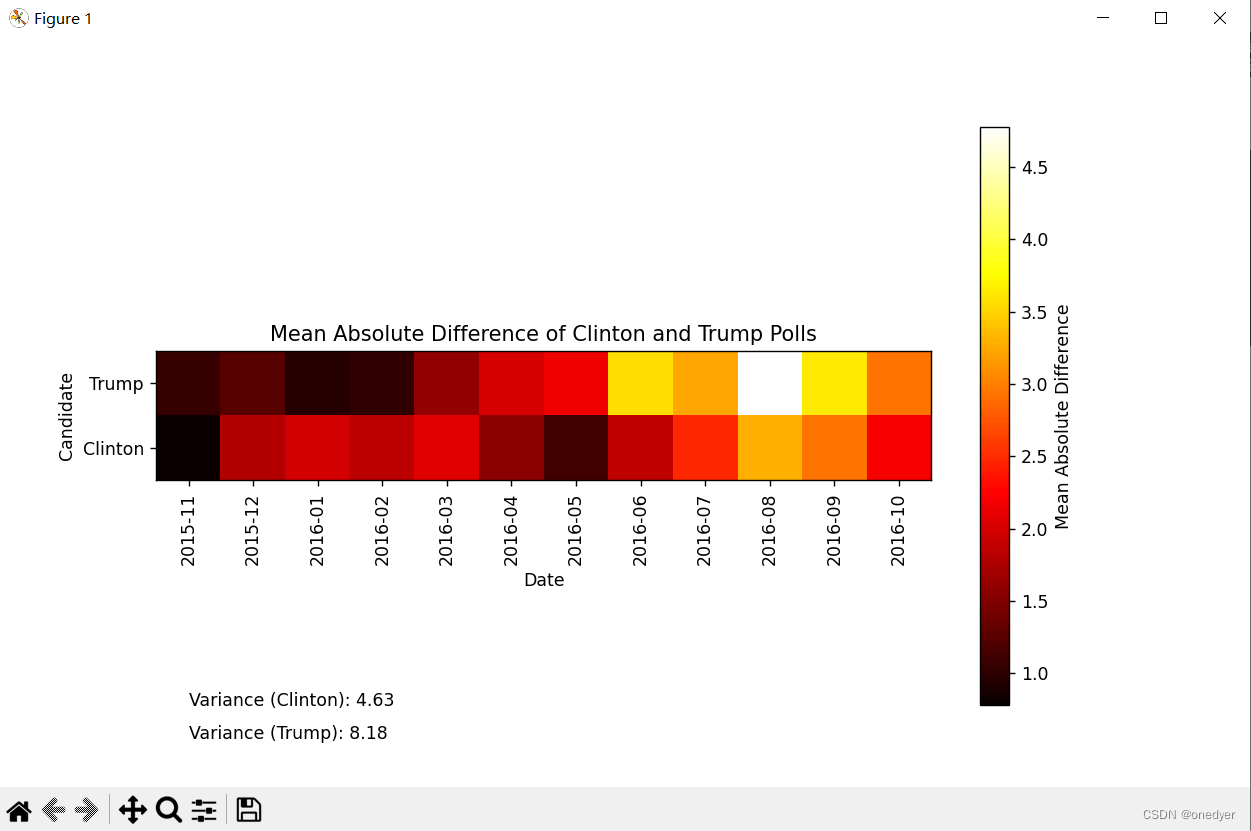
利用2016年美国总统大选数据,选择克林顿和特朗普的数据进行分析,根据每月的平均预测数据与真实数据的平均值之差的绝对值生成热力图,并比较二人的预测偏差大小。
2.源码及注释语句
1
2
3
4
5
6
7
8
9
10
11
12
13
14
15
16
17
18
19
20
21
22
23
24
25
26
27
28
29
30
31
32
33
34
35
36
37
38
39
40
41
42
43
44
45
46
47
48
| import pandas as pd
import matplotlib.pyplot as plt
import numpy as np
df = pd.read_csv('C:/Users/94152/Desktop/presidential_polls.csv')
df['enddate'] = pd.to_datetime(df['enddate']).dt.to_period('M')
df['diff_clinton'] = np.abs(df['adjpoll_clinton'] - df['rawpoll_clinton'])
df['diff_trump'] = np.abs(df['adjpoll_trump'] - df['rawpoll_trump'])
pivot_table = pd.pivot_table(df, values=['diff_clinton', 'diff_trump'], index='enddate', aggfunc='mean')
plt.figure(figsize=(10, 6))
plt.imshow(pivot_table.values.T, cmap='hot', origin='lower')
plt.xticks(range(len(pivot_table.index)), pivot_table.index, rotation=90)
plt.yticks(range(2), ['Clinton', 'Trump'])
cbar = plt.colorbar()
cbar.set_label('Mean Absolute Difference')
plt.title('Mean Absolute Difference of Clinton and Trump Polls')
plt.xlabel('Date')
plt.ylabel('Candidate')
variance_clinton = np.var(df['diff_clinton'])
variance_trump = np.var(df['diff_trump'])
plt.text(0, -4, f"Variance (Clinton): {variance_clinton:.2f}")
plt.text(0, -4.5, f"Variance (Trump): {variance_trump:.2f}")
plt.show()
|
3.结果展示及分析

图中可看出,对特朗普的预测偏差远远大于对克林顿的预测偏差,说明在人们心目中,特朗普的获胜出人意料,反映了美国大选的割裂性


